CyFi Explorer
The focus of CyFi is making it easy to generate predictions using a trained machine learning model. That said, we know it can often be helpful to view predictions in context. That's why we've created CyFi Explorer!
CyFi Explorer lets you see the corresponding Sentinel-2 imagery for each cyanobacteria estimate. The explorer runs locally on your machine and is intended to help you get a sense of where the model is performing well and where it might be getting tripped up. It is not intended to replace more robust data analytics tools and decision-making workflows.
Prerequisite: generating predictions
Before you can visualize predictions, you first have to generate them!
Per the Quickstart page, you'll want to run cyfi predict and specify an input csv containing sampling points (where each row is a unique combination of latitude, longitude, and date).
To use the explorer, you must add the --keep-metadata flag which will output a sentinel_metadata.csv file containing information about the Sentinel-2 image used for each point. For example, to generate predictions from the samples in california/california_samples.csv, you'd run:
cyfi predict california/california_samples.csv --keep-metadata
By default, predictions will be saved to your current working directory. You can specify --output-directory, or -d, to save them to the same folder as your samples instead:
cyfi predict california/california_samples.csv --keep-metadata -d california/
After predictions have been generated, your output directory will look like:
california/
├── california_samples.csv
├── preds.csv
└── sentinel_metadata.csv
Now we're ready to launch the explorer!
Lauching the explorer
Launching the explorer is easy! Simply run cyfi visualize and specify the folder containing your predictions and metadata files.
Per the above example, you would run:
cyfi visualize california/
And you'll see the following print out:
16:06 $ cyfi visualize california/
Running on local URL:  http://127.0.0.1:7860

To create a public link, set `share=True` in `launch()`.
Clicking on the http://127.0.0.1:7860 link will open a browser page with the CyFi Explorer.
Navigating the explorer
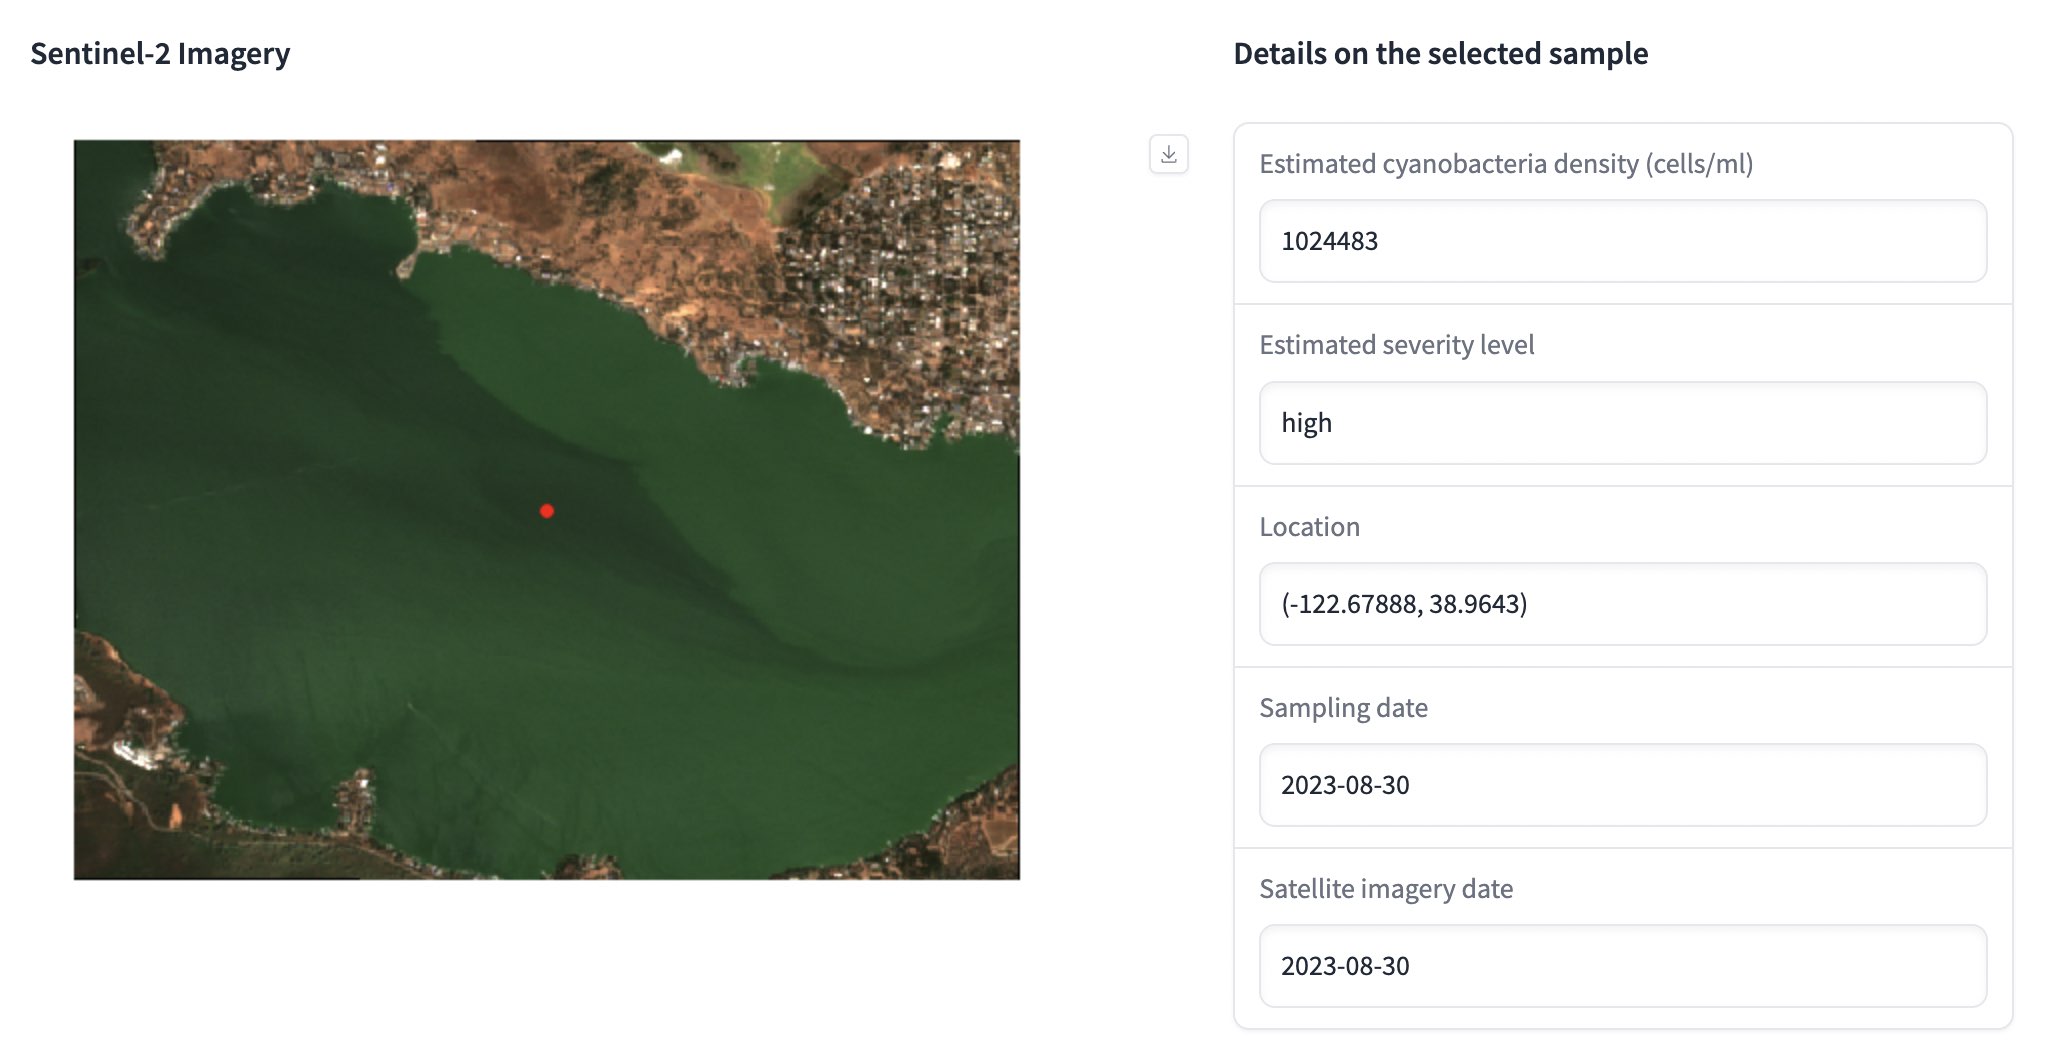
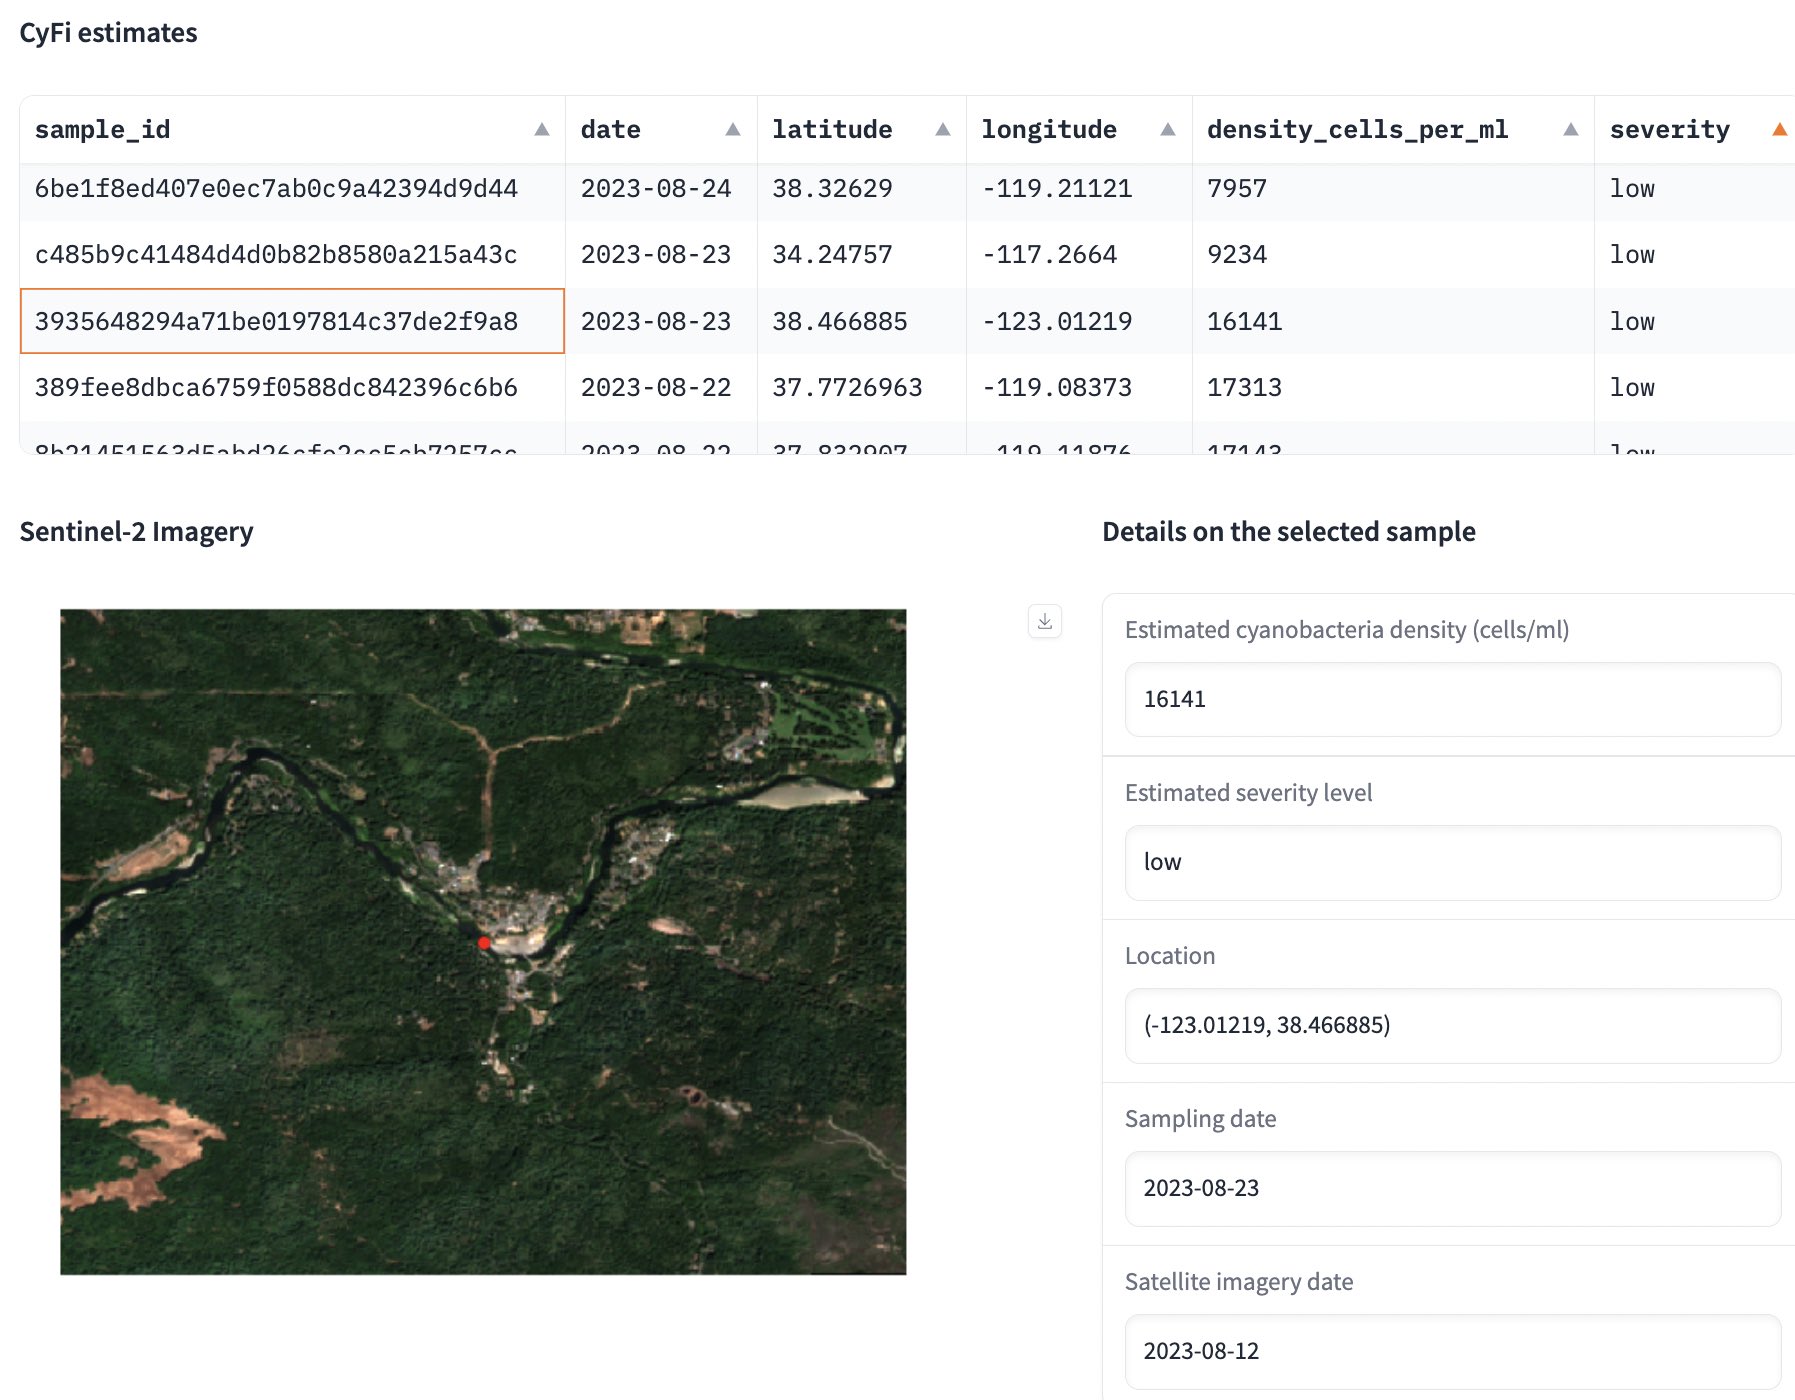
CyFi Explorer is easy to use! Simply click on the sample_id in the table of predictions. The Sentinel-2 image will be displayed along with information about the CyFi prediction and Sentinel-2 image. You can also sort the table by clicking on the column headers.
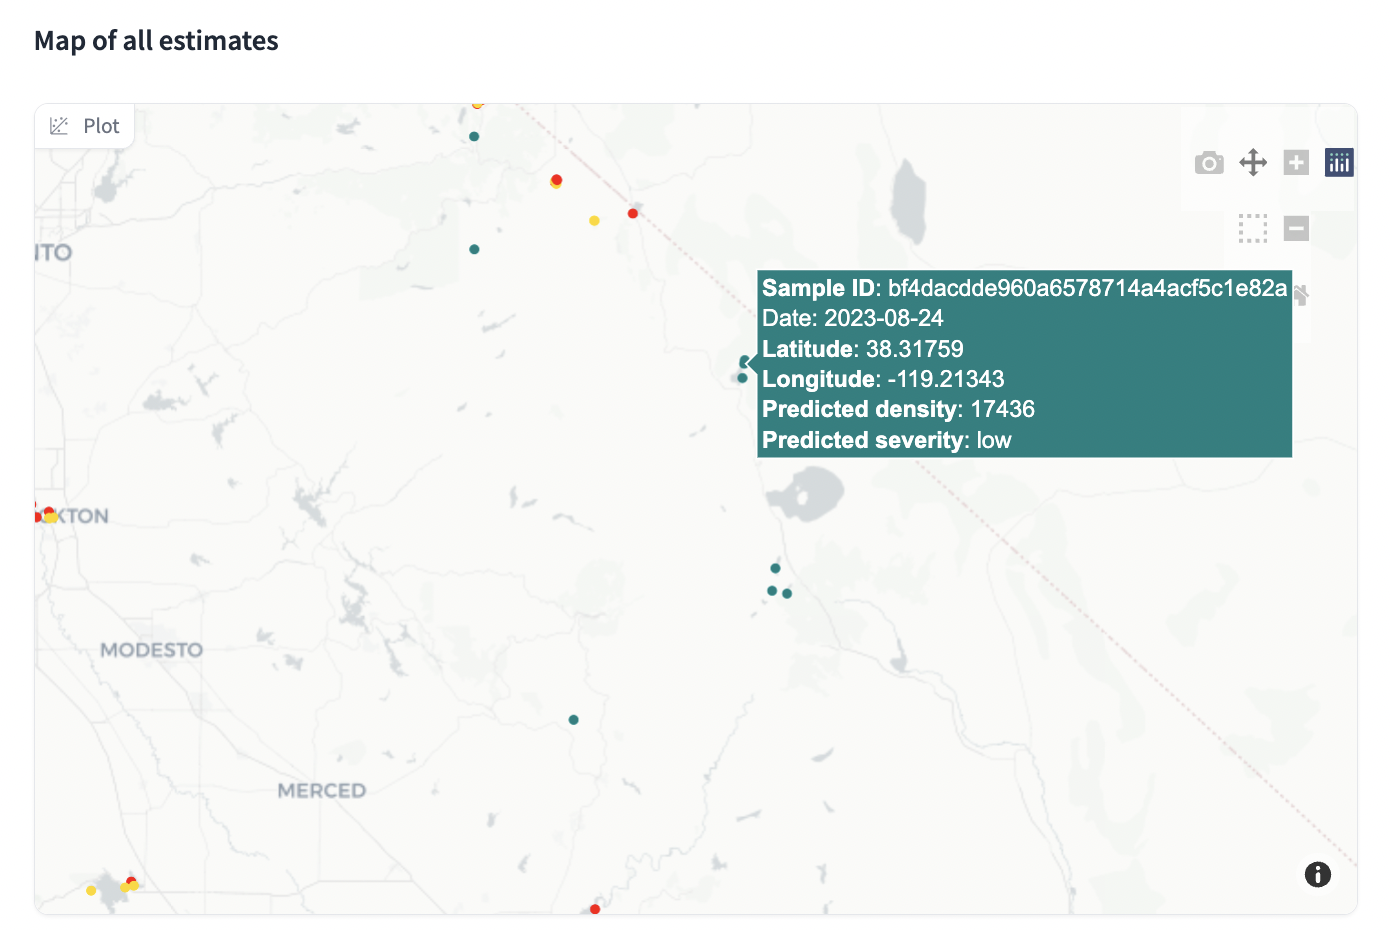
If you scroll down, you'll also find a map with sampling points colored by their estimated severity. Hover over points to see more details.
Happy visualizing!